Nonparametric Statistics in Clinical Trials

Parametric vs Nonparametric Tests
In clinical statistics, when a sample is collected from a population, we use two approaches to explore the data. We use descriptive statistics to describe the sample characteristics and inferential analysis to make inferences about the population from which the sample is coming. To ensure the inference is made appropriately about the population, we try to collect a representative sample from that population and draw conclusions about that population using the sample data.
In making inferences about a population, parametric or nonparametric methods are used;
Parametric methods assume that sample data come from a population that can be adequately modelled by a probability distribution, the probability distribution has a fixed set of parameters, and draw a conclusion about the population mean.
Nonparametric methods do not assume that sample data come from a population that follows a specific distribution and draw a conclusion about the population median. Nonparametric tests are also known as distribution-free tests.
When to use nonparametric tests?
Generally speaking, we use nonparametric tests when we are unable to use parametric tests. For example, we use nonparametric tests when the data does not follow any particular distribution, i.e., not normally distributed or the population variance is heterogeneous. In addition, when the sample size is too small, the data is at a nominal or ordinal level and/ or the data is better presented with a median than a mean, we use nonparametric tests.
Advantages and Disadvantages of Nonparametric tests
Nonparametric tests can come to the rescue when parametric tests are inappropriate. These tests are appropriate for potential nonnormal data and when the sample size is small. Since no distributional assumption is required for nonparametric tests, they can be used when data does not follow any particular distribution. Also, these tests are applicable to all types of data and can deal with unexpected, outlying observations. When the data is better represented by the median (for example, income), nonparametric tests can be the choice of interest.
One disadvantage of using a nonparametric test when we could use a parametric test, that the test will lack power compared to the parametric tests. Parametric tests use more information in calculating the test statistics, such as mean and standard deviation, vs nonparametric tests only use the ranking of the data. The use of fewer information results in less power in the nonparametic test.
Central limit Theorem
There are many parametric distributions such as exponential, uniform, poisson, and logistic distributions. But the most known and used distribution is the Normal Distribution. One reason normal distribution is so popular and frequently used is the Central Limit Theorem (CLT). The CLT states that the distribution of sample means approximates a normal distribution as the sample size gets larger, regardless of the population’s distribution. We will illustrate with an example to see what CLT means.
We can simulate a random sample of size 1000 from an exponential distribution with lambda (rate)= 0.2.
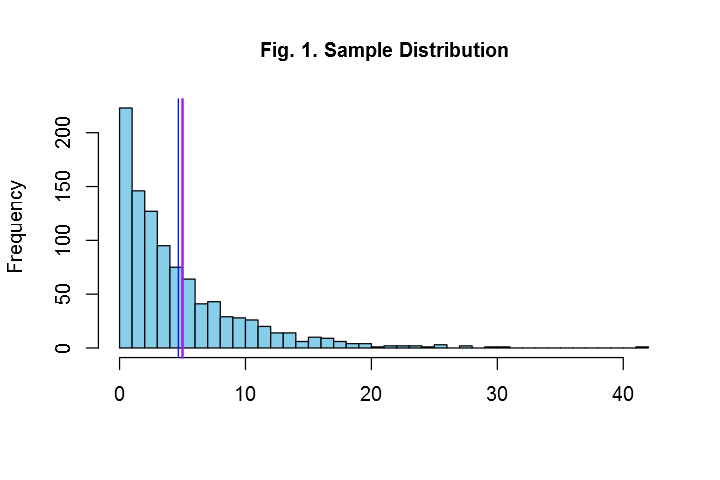
Now let us simulate an exponential distribution of size 40 with lambda=0.2 and calculate the mean for this sample. Let us simulate another exponential distribution of size 40 with lambda=0.2 and calculate the mean for this sample. If we repeat this process 1000 times, then we have 1000 means for 1000 different samples. Let us plot these means in a histogram.
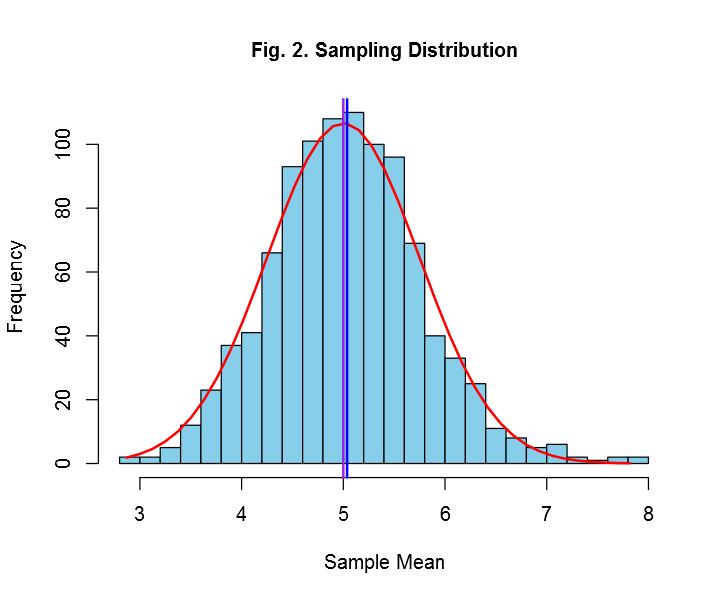
Due to the amazing CLT, we can conduct parametric tests in sample data that does not come from a population that follows normal distribution as the sample size increases! A very powerful theorem, indeed!
Performing Parametric vs Nonparametric test (a simple example)
Let us consider we have a sample of 10 individuals.
| n | 1 | 2 | 3 | 4 | 5 | 6 | 7 | 8 | 9 | 10 |
| Weight (kg) | 17.6 | 20.6 | 22.2 | 15.3 | 20.9 | 21.0 | 18.9 | 18.9 | 18.9 | 18.2 |
For the parametric test, we will test if the population mean differs from 25.
H0: µ=25 (µ is population mean)
H1: µ ≠ 25
To test the hypothesis, we will use the information of the sample mean= 19.25, sample standard deviation=2.0, and sample size=10.
For the nonparametric test, we will test if the population median differs from 25.
We need to rank the differences from each observation from the hypothesized median to test the hypothesis.
| weight | 17.6 | 20.6 | 22.2 | 15.3 | 20.9 | 21.0 | 18.9 | 18.9 | 18.9 | 18.2 |
| Difference
From hypothesized median 25 |
7.4 | 4.4 | 2.8 | 9.7 | 4.1 | 4 | 6.1 | 6.1 | 6.1 | 6.8 |
| + Rank | 9 | 4 | 1 | 10 | 3 | 2 | 6 | 6 | 6 | 8 |
As we can see, the information used for nonparametric tests are rather ranks than sample median, unlike parametric tests that use sample statistics. Therefore, the test statistics and the information used to calculate that test statistic in nonparametric tests do not have any simple interpretations.
Case: Nonparametric Tests
Below are some of the commonly used nonparametric tests that can be used in different clinical trial designs.
| Nonparametric Test | Parametric Alternative | Additional info/assumption |
| 1- sample sign test | 1-sample t-test | |
| 1- sample Wilcoxon signed rank test* | *The difference scores are symmetrically distributed | |
| 2- sample Wilcoxon signed rank test | Paired t-test | The difference scores are symmetrically distributed |
| Mann-Whitney test/Wilcoxon rank-sum test | Independent/2-samples t-test | Same shape distributions for both groups |
| Kruskal-Wallis test* | One-way ANOVA | *Same shape distributions for all groups
*Use in the absence of outliers |
| Mood’s Median test# | #More robust to outliers | |
| Friedman test | Two-way ANOVA | |
| Spearman Rank Correlation* | Pearson’s Correlation Coefficient | *For strictly monotonic relationship |
| Goodman Kruska’s Gamma# | #Comparable with Kendell’s tau, applicable for nonmonotonic relationship. |
Hodges-Lehmann Estimator
The Hodges-Lehmann estimator (HL estimator) was originally developed as a non-parametric estimator of a shift parameter. As it is widely used in statistical applications, the question is investigated what it is estimating if the shift model does not hold. It is shown that for data whose distributions are symmetric about their median, the Hodges-Lehmann estimator based on the Wilcoxon Rank Sum test estimates the difference between the medians of the distributions. This result does generally not hold if the symmetry assumption is violated.
Consider the below example, where we have two groups of people with some sort of measurements to calculate the HL-estimator.
As shown, the sample median for group A and group B is 35.2 and 19.2.
To calculate the Hodges-Lehmann estimator, we conduct the following steps:
- Each member of group A is compared with each member of group B to obtain the differences: 81 Differences.
- Rank the differences.
- Find the median of the differences with the associated confidence interval. For this example, the HL estimator=7.8.
HL estimator is also known as an estimate of the median differences, median of the differences, or location shift. The term estimate of the median differences has been coined in many articles, including FDA’s statistical review such as Icopsapent ethyl, Veltassa. If the distributions of the data are symmetric about their respective medians, the HL estimator does estimate the median differences.
Some may confuse that the HL estimator is the same as the sample median differences. In this example, HL estimator=7.8 where the sample median difference is= 16.2. While they can be the same for some data, they do not necessarily need to be identical, as the steps involved in calculating the HL estimator are different from calculating the sample mean.
Does the Nonparametric methods test for the median difference?
Yes! If the assumption about the shape of the distribution is met.
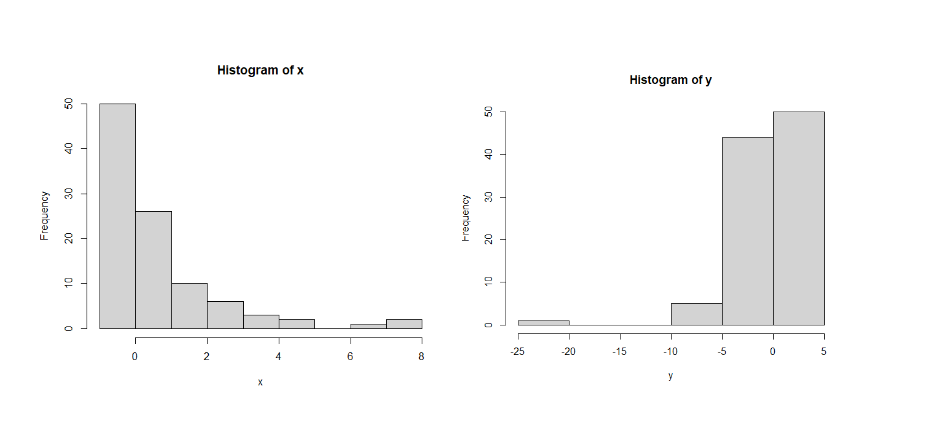
In the example below, the median in both data is 0. One would assume that the Kruskal-Wallis test would be insignificant. However, K-W test is significant! This is because K-W test is testing if the shape of the distributions are different and indeed, they are. If the shape of the distributions were the same for both data, then we could stretch the K-W test to test the difference in the median for these populations.
Nonparametric Regression
So far, the nonparametric tests we have discussed allow us to adjust for at most two factors. But if we have multiple covariates that we want to adjust for, we will need to conduct a nonparametric regression analysis.
As an example of a parametric model, let us look at a multiple linear regression model.
Yi= ß1X1 + ß2X2 + ß3X3 + ß4X4+ ε
Where Y is the dependent variable and Y1,..,X4 are the independent variables. In the parametric approach, the model is fully described by a finite set of parameters (in this example, ß1,…,ß4) that has an easy interpretation.
In the nonparametric statistcs approach, a model can be described as:
Yi=m1(X1)+ m2(X2)+ m3(X3)+ m4(X4)+ ε
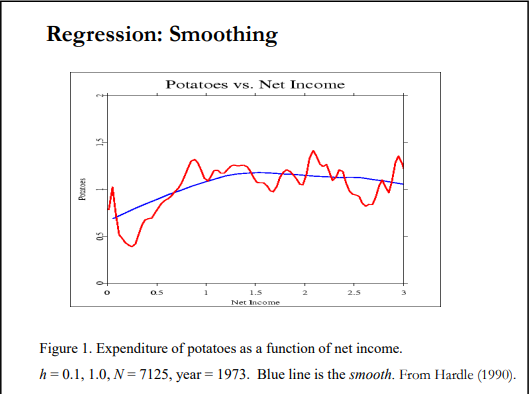
where, m1(X1), …, m4(X4) are the unknown functional relationship between X and Y. In the nonparametric regression, we estimate the shape of the relationship between Y and X. In the below graph, the relationship between X and Y are estimated using nonparametric regression. The red and the blue curves denote the observed vs the estimated relationship between X and Y. Different smoothing techniques such Kernel, B-spline etc. can be used to determine the shape of this relationship.
Why Choose BioPharma Services
In this blog, we summarized nonparametric statistics and their use in clinical trials. They are growing in popularity as sponsors and agencies are more and more interested in the pharmacokinetics profile of specific PK parameters that can not necessarily be analyzed with the parametric methods. Some takeaway messages from this post could be:
- According to Central Limit Theorem, the sample mean follows a normal distribution as n increases, regardless of which distribution the data came from (the beauty of Normal distribution!).
- Nonparametric methods can be used as an alternative to parametric methods.
- The nonparametric tests are relatively straightforward. However, the interpretations are not.
- If the assumption about the shape distribution is met, nonparametric methods can test for the median difference between groups.
- Nonparametric regressions can adjust for multiple covariates, however, we cannot interpret the regression coefficients as we do in a parametric regression model. We can only estimate and interpret the shape of the relationship between the dependent and independent variables.
Written by Arfan Raheen Afzal, Senior Biostatistician at BioPharma Services.
Find out why BioPharma might be the right partner for you! Learn more about BioPharma Services and the wide array of bioanalytical services we provide.
BioPharma Services, Inc., a Think Research Corporation and clinical trial services company, is a full-service Contract Clinical Research Organization (CRO) based in Toronto, Canada, specializing in Phase 1 clinical trials 1/2a and Bioequivalence clinical trials for international pharmaceutical companies worldwide. BioPharma has clinical facilities both in the USA and Canada with access to healthy volunteers and special populations.

