Williams Design and its Applications within Clinical Trials
Repeated measures design has been widely used in the early phase hap study, such as the two-way crossover design for a regular Bioequivalence study. Since the same subjects receive multiple measures, one obvious advantage of the repeated measures design is that fewer subjects are needed to be compared to a parallel design. When there are more than two treatments, there will be different ways to arrange the treatment sequences.
Williams’s design is one of the well-known balanced designs for repeated measures with more than two treatments. There are some similarities between the Williams Design and the Latin Square. Actually, William’s design can be considered as a special case of the Latin square.
In the first section of this blog, we will start from a brief introduction of the Latin Square. And the second section will go through the general rules of preparing Williams design and the corresponding underlying conditions. For the last section, we will shed some light on the application of the Williams design, which is the human abuse potential study.
Section 1: What is Latin Square?
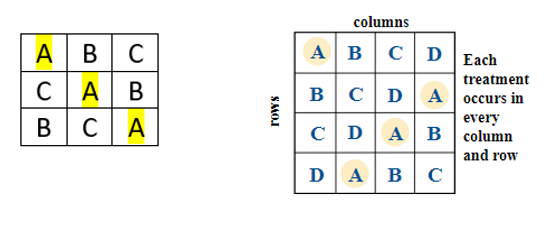
A Latin square is an n × n array filled with n different elements, each occurring exactly once in each row and exactly once in each column. As highlighted in the above two Latin square examples, treatment A appears one time and one time only in each row and each column.
There are few advantages and disadvantages of using Latin square design. The advantages include:
- The design could control the impact of several nuisance factors;
- HAP Studies with Latin square design will require fewer runs or tests of the combination of factors;
- Similar to other repeated measure designs, Latin square design need fewer subjects.
The disadvantages contain:
- The number of levels of the nuisance factors must equal the number of levels of the treatment.
- Latin square design assumes there is no interaction between the two factors.
- If the number of treatments is small, there may be too few degrees of freedom for experimental error when conducting ANOVA.
Latin square is the cornerstone of the Williams design, but not every single Latin square can be used as a Williams design. We will introduce the details in the next section.
Section 2: What are Williams Designs?
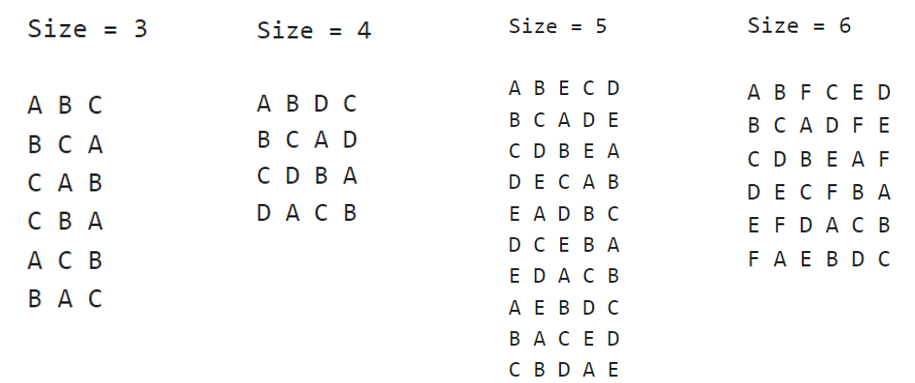
There are general rules of using Latin square to create a Williams design, which are:
- When the number of treatments n is an even number: a balanced design is possible with one appropriate Latin square.
- When the number of treatments n is an odd number: two appropriate Latin squares are required.
The above Williams design examples further indicate the rules. When the number of treatments is 3 and 5, there are two 3 x 3 and 5 x 5 Latin squares, respectively. However, when the number of treatments is 4 and 6, one appropriate Latin square is enough for a Williams design.
The general rules are straightforward and easy to follow. However, there might be some confusions regarding why we need to follow the rules. It is related to the underlying conditions of the Williams design.
There are two conditions for a balanced design:
- Each treatment should occur equally frequently at each position.
- Each treatment should be preceded by each other treatment equally.
Basically, the first condition aligns with the definition of the Latin square, so any Latin square would work under this condition. However, the second condition plays an important role in achieving a balanced design.
In order to meet the second condition, we need to consider all possible pairs of treatment. For example, if there are two treatments A and B, there will be two possible pairs of treatment AB and BA. If there are three treatments A, B and C, there will be six possible pairs of treatment (AB, BA, BC, CB, AC, CA). Generally, if the number of treatments is n, there will be n(n-1) possible pairs of treatments.
The reason for considering all pairs of treatment is to balance the first-order carryover effect. The first-order carryover effect is defined as the impact on outcome from the previous adjacent treatment on the current treatment. By taking into account the second condition, each treatment will be impacted equally frequently by each other treatments, which will minimize the impact of the first-order carryover effect.
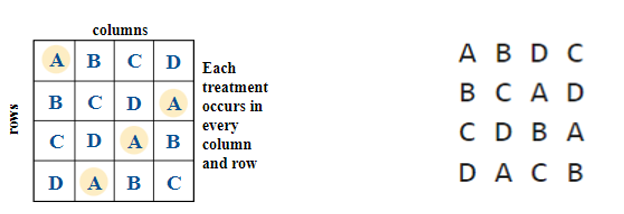
In the above examples, the Latin square in the left-hand side is from the previous example. In this 4 x 4 Latin square, the pair of treatment AB appears 3 times, which are on the first, the third and the last row.
However, there is not a single pair of treatment BA. It is the same for the pairs of treatment BC, CD, and DA. Based on the second condition of Williams design introduced previously, the first Latin square is not suitable for a balanced Williams design.
In the right-hand side example, we have one pair of treatment AB and BA, respectively. Similar for the pairs of treatment BC, CB, AC, CA, etc. The second Latin square would be a good fit for a Williams design. And the Latin square is called an Orthogonal Latin Square. The reason for calling it as orthogonal Latin square is because we have rows that are exactly in opposite sequences. If looking close to the Latin square, we will notice that the first row is in a sequence of ABDC, while the third row is in an opposite sequence of CDBA. It is also the same for the second and the fourth rows.
By which mean, even for the even number of treatments, we could not randomly pick a Latin square for the Williams design but find the appropriate one.
It will raise another question: can we find one appropriate Latin square for the Williams design when there is an odd number of treatments? The answer is no.
There is an example which will be helpful to explain the question. In order to show the example, we need to briefly introduce the Residue Modulo first.
Suppose m and n are any two integers. If m divided by n have a remainder r (m=kn+r), we say that r is a residue of m in modulo n. For example, 18 divided by 5 have a remainder 3, so 3 is a residue of 18 in modulo 5. In general, in modulo n, there are n possible residues 0, 1, 2, 3, …, n-2, n-1.
In the Williams’ paper, the residue modulo is used as an example of a Williams Design. Assume each treatment is one of the classes of a complete residual modulo n, the differences between any two adjacent treatments can be calculated, and the values will be range from 1 to n-1.
When the number of treatment n is an even number, we could use the below row as the first row of a Latin square. It covers all treatments from 0 to n-1. The differences between two adjacent treatments are calculated, as highlighted in the following picture. The differences highlighted in blue are 1, 3, 5, 7, 9, etc., we could easily identify that they are all odd numbers, and they are in an increased trend.
However, there are another set of number highlighted in red, which are n-2, n-4, n-6, etc. Since n is an even number, these values are also even numbers, and they are in a decreased trend. Following these two trends, we will have all possible differences once. By which mean, all possible differences between two adjacent treatments are included in one Latin square.

When the number of treatment n is an odd number, we could use a similar row as the first row of a Latin square and calculate the differences between two adjacent treatments. As shown in the following picture, there is a same trend for values 1, 3, 5, 7, etc., which are increased odd numbers. However, for another set of differences, which are n-2, n-4, n-6, etc., since n is an odd number, these values are also odd numbers now. With one set of increased odd numbers and another set of decreased odd numbers, we will end up with all odd differences twice.

The above example shows that using one Latin square for an odd number of treatments will completely ignore one possible type of differences, which will lead to an unbalanced design. To achieve balance, a second Latin square with opposite sequences need to be added. In the below example, the first row from a second Latin square is added.
The differences between two adjacent treatments are calculated and highlighted in red. There are one set of decreased even numbers (6, 4, 2, etc.) and another set of increased even numbers (n-5, n-3, n-1 etc.), which cover all even differences twice.

For an odd number of treatments, by combing two Latin squares, all possible differences are covered, which meet the second condition of the Williams design eventually.
Section 3: Application of the Williams Design in HAP Studies
William designs are widely used in Human Abuse Potential (HAP study).
HAP studies assess the likelihood that a drug with pharmacological activity on the central nervous system produces positive subjective responses that are indicative of abuse potential. HAP studies are normally early phase clinical trials, so the study subjects are not patients but healthy recreational drug users who have experience with the same class of test drug.
There are at least four treatments, which are two doses of one test drug, one positive control and one placebo. The outcomes for HAP studies are mainly subjective abuse-related response, such as drug liking VAS, good effects/bad effects VAS, any effects VAS etc.
The statistical analyses of HAP studies are normally testing the following three hypotheses.
- Validation test of the sensitivity and integrity of the study: Does the positive control (C) produce mean responses that show greater abuse potential compared to placebo (P)? Thus, the hypothesis should be tested as following:
- Does the test drug (T) produce mean responses that show less abuse potential compared to positive control?
- Does the test drug produce mean responses that show similar abuse potential compared to placebo?
The first hypothesis is testing the sensitivity and integrity of the HAP study, evaluating if the study is sensitive enough to detect a difference between the known positive control (C) and the placebo (P). Similar for the second and the third hypotheses, which are comparing the test drug (T) with the positive control (C), and the test drug (T) with the placebo (P), respectively.
In the hypotheses, the value of 1, 2, 3 vary for the different subjective measures. For example, 1=15 is normally used for the drug liking Emax.
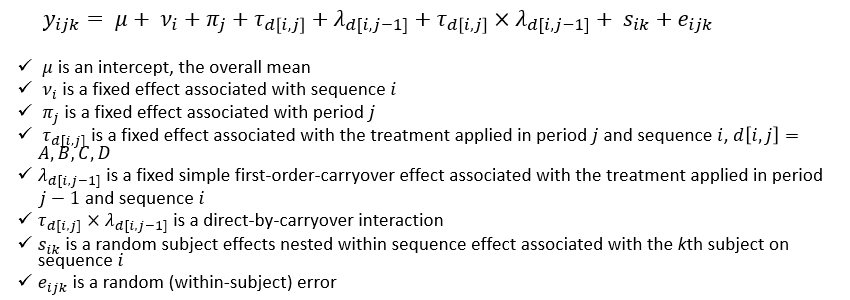
The statistical model used in HAP studies is a linear-mixed effect model. The following picture shows a full model for k repeated t ×t Latin square design:
Since the above full model is for k repeated Latin square design, so it includes more variables than a simplified model. In the full model, the sequence, period, treatment, first-order carryover effect, treatment, and carryover effect interaction term are included as fixed effects, and subject as a random effect. The treatment and carryover effect interaction term is also called direct-by-carryover interaction, which is a potential-mixed carryover effect.
For a regular Williams design, there is no sufficient degrees of freedom to access so many terms as shown in the above full model, so a simplified model can be used. In the simplified model, the period, sequence, treatment, and first-order carryover effect will be included as fixed effects, and subject as a random effect.
Given that the first-order carryover effect is included in the model, a further evaluation of the carryover effect is needed. To assess the carryover effect, the below hypothesis is testing:
H0 : there is no first-order carryover effect | H1: there is a first-order carryover effect
The null hypothesis is that there is no first-order carryover effect, while the alternative hypothesis is there is a first-order carryover effect. Since the HAP studies are normally conducted with a relatively small sample size, it is possible to make Type II error, which is failed to reject the null hypothesis when it is not true. To reduce the possibility of making Type II error, a significant level larger than 5% is normally used.
The commonly used significance level is 25%, and there are three scenarios:
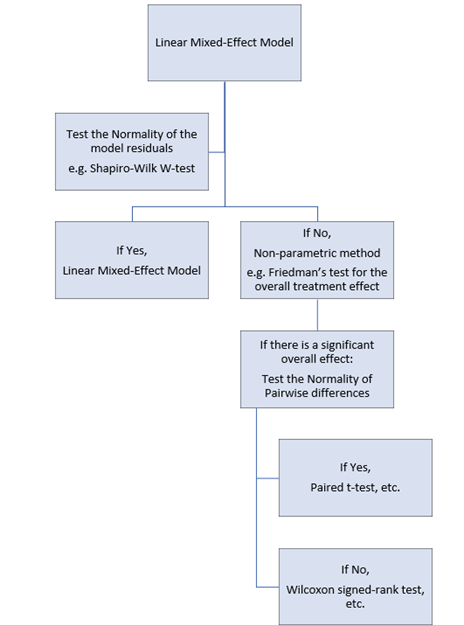
Similar to other parametric methods, there are several underlying assumptions for the linear mixed-effects model. If any of the assumptions is violated, other methods need to be used instead. The below picture shows a flowchart about how to proceed with the analyses.
Why Choose BioPharma Services?
BioPharma Services is a full-service Contract Research organization (CRO) specializing in Phase 1 clinical trials, Bioavailability, Bioequivalence and Human Abuse Potential Studies (HAP). Our Stats team provides statistical inputs on various trials, especially in the field of the statistical methodologies including study design, sample size calculation, statistical modeling, data handling, analysis and reporting.
Find out why BioPharma might be the right partner for you! Learn more about BioPharma Services and the wide array of bioanalytical services we provide.
BioPharma Services, Inc., a Think Research Corporation and clinical trial services company, is a full-service Contract Clinical Research Organization (CRO) based in Toronto, Canada, specializing in Phase 1 clinical trials 1/2a and Bioequivalence clinical trials for international pharmaceutical companies worldwide. BioPharma has clinical facilities both in the USA and Canada with access to healthy volunteers and special populations.

