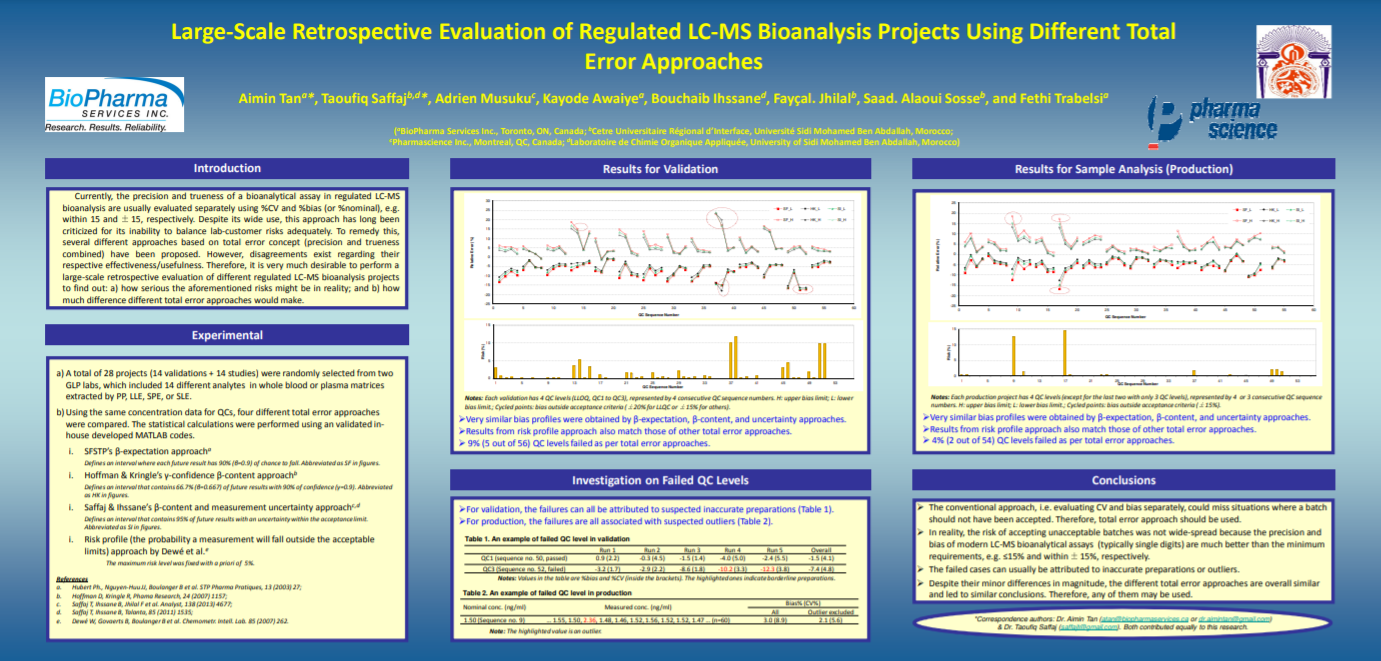
Large-Scale Retrospective Evaluation of Regulated LC-MS Bioanalysis Projects Using Different Total Error Approaches
PRESENTED TO: (a) BioPharma Services Inc., Toronto, ON, Canada; (b) Cetre Universitaire Régional d’Interface, Université Sidi Mohamed Ben Abdallah, Morocco; (c) Pharmascience Inc., Montreal, QC, Canada; (d) Laboratoire de Chimie Organique Appliquée, University of Sidi Mohamed Ben Abdallah, Morocco
PRESENTED BY: Aimin Tana*, Taoufiq Saffajb,d*, Adrien Musukuc, Kayode Awaiyea, Bouchaib Ihssaned, Fayçal. Jhilalb, Saad. Alaoui Sosseb, and Fethi Trabelsia
INTRODUCTION
Currently, the precision and trueness of a bioanalytical assay in regulated LC-MS bioanalysis are usually evaluated separately using %CV and %bias (or %nominal), e.g. within 15 and ±15, respectively. Despite its wide use, this approach has long been
criticized for its inability to balance lab-customer risks adequately. To remedy this, several different approaches based on total error concept (precision and trueness combined) have been proposed. However, disagreements exist regarding their respective effectiveness/usefulness. Therefore, it is very much desirable to perform a large-scale retrospective evaluation of different regulated LC-MS bioanalysis projects to find out: a) how serious the aforementioned risks might be in reality; and b) how much difference different total error approaches would make.
EXPERIMENTAL
a) A total of 28 projects (14 validations + 14 studies) were randomly selected from two GLP labs, which included 14 different analytes in whole blood or plasma matrices extracted by PP, LLE, SPE, or SLE.
b) Using the same concentration data for QCs, four different total error approaches were compared. The statistical calculations were performed using an validated inhouse developed MATLAB codes.
i. SFSTP’s β-expectation approach (a)
Defines an interval where each future result has 90% (β=0.9) of chance to fall. Abbreviated as SF in figures.
i. Hoffman & Kringle’s γ-confidence β-content approach (b)
Defines an interval that contains 66.7% (β=0.667) of future results with 90% of confidence (γ=0.9). Abbreviated as HK in figures.
i. Saffaj & Ihssane’s β-content and measurement uncertainty approach (c), (d)
Defines an interval that contains 95% of future results with an uncertainty within the acceptance limit.
Abbreviated as SI in figures.
i. Risk profile (the probability a measurement will fall outside the acceptable limits) approach by Dewé et al.e
The maximum risk level was fixed with a priori of 5%.
References
a. Hubert Ph., Nguyen-Huu JJ, Boulanger B et al. STP Pharma Pratiques, 13 (2003) 27;
b. Hoffman D, Kringle R, Phama Research, 24 (2007) 1157;
c. Saffaj T, Ihssane B, Jhilal F et al. Analyst, 138 (2013) 4677;
d. Saffaj T, Ihssane B, Talanta, 85 (2011) 1535;
e. Dewé W, Govaerts B, Boulanger B et al. Chemometr. Intell. Lab. 85 (2007) 262.
RESULTS FOR VALIDATION

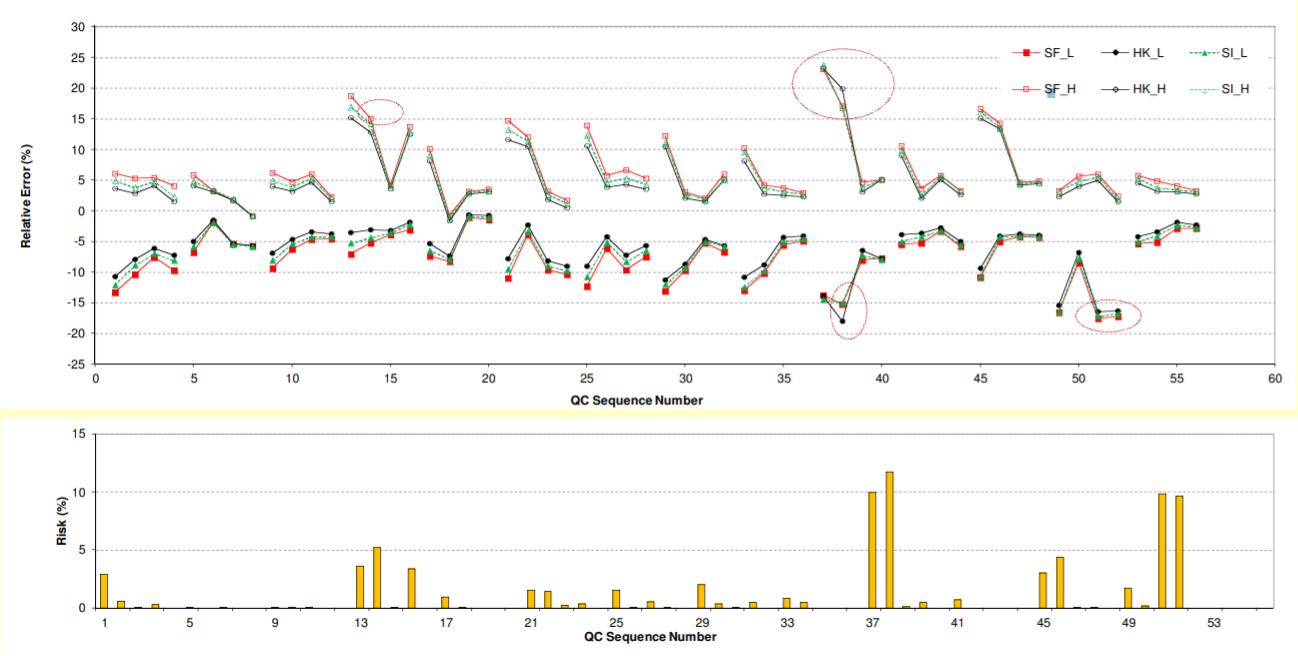
Notes: Each validation has 4 QC levels (LLOQ, QC1 to QC3), represented by 4 consecutive QC sequence numbers. H: upper bias limit; L: lower bias limit.; Cycled points: bias outside acceptance criteria (±20% for LLQC or ±15% for others)
• Very similar bias profiles were obtained by β-expectation, β-content, and uncertainty approaches.
• Results from risk profile approach also match those of other total error approaches.
• 9% (5 out of 56) QC levels failed as per total error approaches.
• For validation, the failures can all be attributed to suspected inaccurate preparations (Table 1).
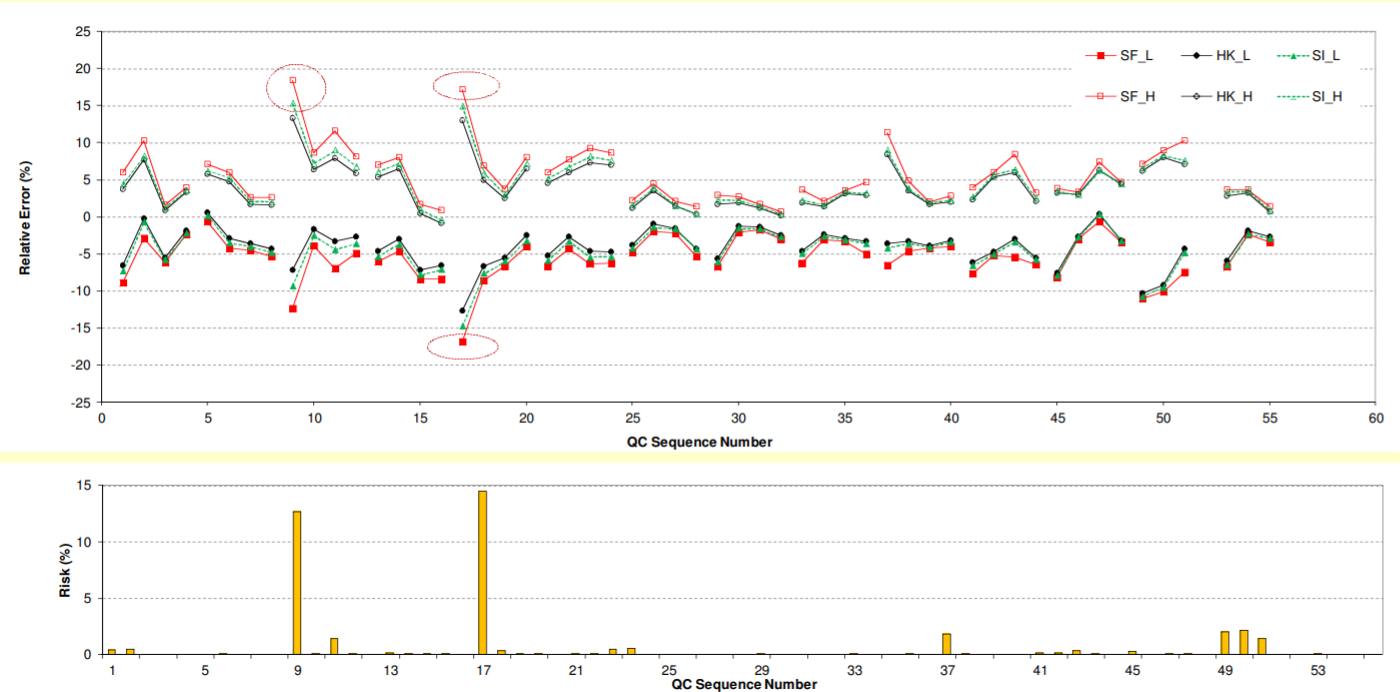
• For production, the failures are all associated with suspected outliers (Table 2).
Table 1. An example of failed QC level in validation
| Run 1 | Run 2 | Run 3 | Run 4 | Run 5 | Overall | |
| QC1 (sequence no. 50, passed) | 0.9 (2.2) | -0.3 (4.5) | -1.5 (1.4) | -4.0 (5.0) | -2.4 (5.5) | -1.5 (4.1) |
| QC3 (Sequence no. 52, failed) | -3.2 (1.7) | -2.9 (2.2) | -8.6 (1.8) | -10.2 (3.3) | -12.3 (3.8) | -7.4 (4.8) |
Notes: Values in the table are %bias and %CV (inside the brackets). The highlighted ones indicate borderline preparations.
Table 2. An example of failed QC level in production
| Bias% (CV% | |||
| Nominal conc. (ng/ml) | Measured conc. (ng/ml) | All | Outlier excluded |
| 1.50 (Sequence no. 9) | … 1.55, 1.50, 2.36, 1.48, 1.46, 1.52, 1.56, 1.52, 1.52, 1.47 … (n=60) | 3.0 (8.9) | 2.1 (5.6) |
Note: The highlighted value is an outlier.
METHOD(S)
Using the Monte Carlo method in this simulation, the between subject variance, and the variance for the test were set to be equal to that of the reference product for the PK parameter Cmax. The random numbers were combined with Cmax value in a log scale and variance estimates to create simulated data with 4-way, 2-sequence replicated design. One Thousand (1000) simulations at each level of ISCV 5%, 10%, 15%, 20% and 22%, respectively, created simulated data with total of sample size of 16, 20 and 24, respectively. The method published by US FDA draft guidance on warfarin sodium for statistical analysis using the referencescaled (SABE) approach for NTI drugs was used for this study. The major indicators that were examined are sample size, geometric ratio (GMR), 95% upper bound, 90% confidence interval(CI), the upper limit of the 90% CI for the ratio of within-subject standard deviation of Test to Reference and power.
The sample size estimated with traditional approach was obtained assuming 90% to 111% CI, five levels of ISCV, 5% product difference and 80%, 90% power for two way crossover and replicated designs. SAS® 9.4 was used for all statistical analysis.
For BE assessment, the following conditions must be met to determine BE according to FDA Draft Guidance:
• Use the unscaled average bioequivalence procedure to determine BE for individual PK parameter(s). The acceptable limits for regular unscaled bioequivalence limits of 90% CIs is 80.00-125.00%.
• Use the referenced-scaled procedure to determine BE for individual PK parameter(s). The 95% upper confidence bound is less than or equal to zero.
• Calculate the 90% CI of the ratio of the within subject standard deviation of test product to reference product. The upper limit of the 90% CI for ratio is less than or equal to 2.5.
RESULTS FOR SAMPLE ANALYSIS (PRODUCTION)

Notes: Each validation has 4 QC levels (LLOQ, QC1 to QC3), represented by 4 consecutive QC sequence numbers. H: upper bias limit; L: lower bias limit.; Cycled points: bias outside acceptance criteria (±20% for LLQC or ±15% for others)
• Very similar bias profiles were obtained by β-expectation, β-content, and uncertainty approaches.
• Results from risk profile approach also match those of other total error approaches.
• 4% (2 out of 54) QC levels failed as per total error approaches.
CONCLUSIONS
• The conventional approach, i.e. evaluating CV and bias separately, could miss situations where a batch should not have been accepted. Therefore, total error approach should be used.
In reality, the risk of accepting unacceptable batches was not wide-spread because the precision and bias of modern LC-MS bioanalytical assays (typically single digits) are much better than the minimum requirements, e.g. ≤15% and within ±15%, respectively.
• The failed cases can usually be attributed to inaccurate preparations or outliers.
• Despite their minor differences in magnitude, the different total error approaches are overall similar and led to similar conclusions. Therefore, any of them may be used.


