Sample Size Needed to Demonstrate BE for Narrow Therapeutic Drugs
PRESENTED TO: BioPharma Services Inc., Toronto, ON, Canada
PRESENTED BY: Yu Ding, Juan He, Priscila Pequeno and Fethi Trabelsi
PURPOSE
Sample size calculation plays an important role in pharmaceutical research and development as it allows to have adequate
statistical power to draw appropriate conclusions. For Highly variable drug (HVD), the reference scaled average bioequivalence (SABE) is now commonly used and deemed helpful for HVD meet the acceptance criteria. For narrow therapeutic index (NTI) drug, the acceptance criteria are tightened by the regulatory agencies as small differences in dose or blood/plasma concentration may impact significantly on efficacy and/or safety. The sample size for NTI could be very large when we use the traditional approach-including power, intra-subject coefficient variability (ISCV), ratio for formulations and confidence interval 90%-111% as requested by many agencies. The US Food and Drug Administration (FDA) recently published new draft guidance on the requirement for warfarin formulations, which is considered a NTI drug, and the proposed approach is also the reference SABE where the criteria will be tightened in relationship to the variability of the reference product. In other words, the reference scaling is expected to be down for NTI. How does this new approach impact the sample size estimation? Our research applied the proposed FDA approach using 4-way, 2-sequence, fully replicated crossover design to simulate data with different sample sizes at different levels of ISCV of 5%, 10%, 15%, 20% and 22% using thousands of simulations. The objective is to assess the most adequate estimation of the sample size which will give sufficient statistical power to demonstrate BE for NTI drugs.
Table 1 – Summary of Simulated Data Using Fully Replicated Design
| Sample Size | ISCV | Simulation | Meet BE Criteria* | Upper limit of 90% CIs for Ratio of Std Test to Reference is <= 2.5 | Power >=80% if BE met |
| 16 | 0.22 (22%) | 1000 Times | 559 (55.9%) | 883 (88.3%) | 210 (210/559=37.6%) |
| 16 | 0.20 (20%) | 1000 Times | 583 (58.3%) | 880 (88%) | 303 (303/583=52.0%) |
| 16 | 0.15 (15%) | 1000 Times | 728 (72.8%) | 902 (90.2%) | 620 (620/728=85.2%) |
| 16 | 0.10 (10%) | 1000 Times | 777 (77.77%) | 916 (91.6%) | 758 (758/777=97.6%) |
| 16 | 0.05 (5%) | 1000 Times | 809 (80.9%) | 936 (93.6%) | 809 (100%) |
| Sample Size | ISCV | Simulation | Meet BE Criteria* | Upper limit of 90% CIs for Ratio of Std Test to Reference is <= 2.5 | Power >=80% if BE met |
| 20 | 0.22 (22%) | 1000 Times | 663 (66.3%) | 937 (93.7%) | 454 (454/663=68.5%) |
| 20 | 0.20 (20%) | 1000 Times | 752 (75.2%) | 942 (94.2%) | 595 (595/752=79.1%) |
| 20 | 0.15 (15%) | 1000 Times | 828 (82.8%) | 949 (94.9%) | 805 (805/828=97.2%) |
| 20 | 0.10 (10%) | 1000 Times | 886 (88.6%) | 968 (96.8%) | 886 (100%) |
| 20 | 0.05 (5%) | 1000 Times | 882 (88.2%) | 969 (96.9%) | 882 (100%) |
| Sample Size | ISCV | Simulation | Meet BE Criteria* | Upper limit of 90% CIs for Ratio of Std Test to Reference is <= 2.5 | Power >=80% if BE met |
| 24 | 0.22 (22%) | 1000 Times | 764 (76.4%) | 943 (94.3%) | 454 (454/663=68.5%) |
| 24 | 0.20 (20%) | 1000 Times | 803(80.3%) | 963 (96.3%) | 595 (595/752=79.1%) |
| 24 | 0.15 (15%) | 1000 Times | 923(92.3%) | 982 (98.2%) | 805 (805/828=97.2%) |
| 24 | 0.10 (10%) | 1000 Times | 926 (92.6%) | 978 (97.8%) | 886 (100%) |
| 24 | 0.05 (5%) | 1000 Times | 933 (93.3%) | 990 (99%) | 882 (100%) |
Table 3. The Estimated Sample Size for Two-way Crossover Design Using Traditional Approach
| Confidence Limit | Ratio | Power | Sample Size | 0.05 | 0.10 | 0.15 | 0.20 | 0.22 |
| 90% – 111% | 0.925 | 0.8 | N | 42 | 165 | 368 | 647 | 780 |
| 90% – 111% | 0.95 | 0.8 | N | 12 | 43 | 95 | 167 | 201 |
| 90% – 111% | 1.00 | 0.8 | N | 5 | 17 | 36 | 62 | 74 |
| 90% – 111% | 1.05 | 0.8 | N | 11 | 40 | 87 | 153 | 184 |
| 90% – 111% | 1.075 | 0.8 | N | 30 | 114 | 253 | 446 | 537 |
| 90% – 111% | 1.10 | 0.8 | N | 307 | 1222 | 2730 | 4812 | 5799 |

CONCLUSION
Our simulations showed that SABE approach as proposed by FDA for NTI appears to be more flexible when assessing the sample size for BE demonstration.
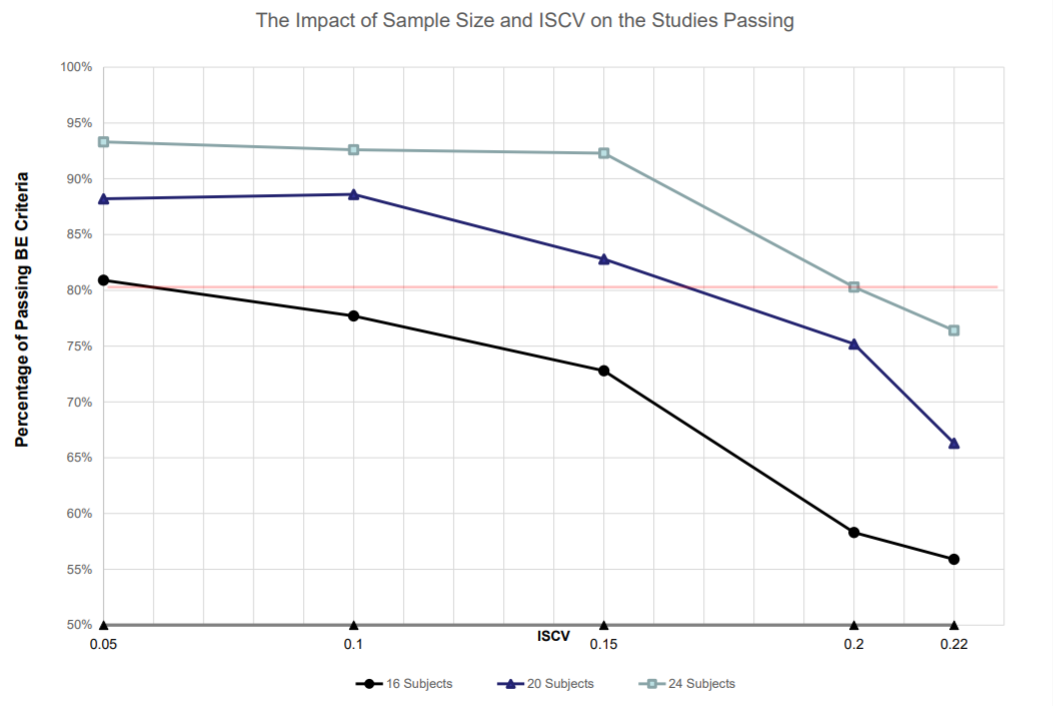
1. The passing rate increases as the ISCV decreases in each of three sample size groups.
2. Total of 24 sample size showed there were more than 90% passing rates when ISCV is equal or less than 15% with strong power.
3. For simulations data which was met BE criteria, if the Ratio of Geometric Means is within 90%-111%, the BE passing rate is above 90% for different levels of ISCV.
4. Sample size of N=24 may be appropriate if ISCV is less than or equal to 15% in a fully replicate design to be well powered.
5. The sample size estimated using this reference SABE in the fully replicated design seems less conservative as compared to the other tightened approach of 90% CI falling within 90% to 111%.
METHOD(S)
Using the Monte Carlo method in this simulation, the between subject variance, and the variance for the test were set to be equal to that of the reference product for the PK parameter Cmax. The random numbers were combined with Cmax value in a log scale and variance estimates to create simulated data with 4-way, 2-sequence replicated design. One Thousand (1000) simulations at each level of ISCV 5%, 10%, 15%, 20% and 22%, respectively, created simulated data with total of sample size of 16, 20 and 24, respectively. The method published by US FDA draft guidance on warfarin sodium for statistical analysis using the referencescaled (SABE) approach for NTI drugs was used for this study. The major indicators that were examined are sample size, geometric ratio (GMR), 95% upper bound, 90% confidence interval(CI), the upper limit of the 90% CI for the ratio of within-subject standard deviation of Test to Reference and power.
The sample size estimated with traditional approach was obtained assuming 90% to 111% CI, five levels of ISCV, 5% product difference and 80%, 90% power for two way crossover and replicated designs. SAS® 9.4 was used for all statistical analysis.
For BE assessment, the following conditions must be met to determine BE according to FDA Draft Guidance:
• Use the unscaled average bioequivalence procedure to determine BE for individual PK parameter(s). The acceptable limits for regular unscaled bioequivalence limits of 90% CIs is 80.00-125.00%.
• Use the referenced-scaled procedure to determine BE for individual PK parameter(s). The 95% upper confidence bound is less than or equal to zero.
• Calculate the 90% CI of the ratio of the within subject standard deviation of test product to reference product. The upper limit of the 90% CI for ratio is less than or equal to 2.5.
Table 2. The Impact of Geometric Mean Ratio (GMR) at the Five Levels of ISCV on the Passing Rate
| Sample Size | ISCV | BE Met | GMR Range | Passing Rate |
| 16 | 0.22 (22%) | Yes | 0.90 <= Ratio <= 1.10 | 559 (559/559=100%) |
| 16 | 0.20 (20%) | Yes | 0.90 <= Ratio <= 1.10 | 571 (571/583=97.3%) |
| 16 | 0.15 (15%) | Yes | 0.90 <= Ratio <= 1.10 | 708 (708/728=97.3%) |
| 16 | 0.10 (10%) | Yes | 0.90 <= Ratio <= 1.10 | 755 (755/777=97.2%) |
| 16 | 0.05 (5%) | Yes | 0.90 <= Ratio <= 1.10 | 807 (807/809=99.8%) |
| Sample Size | ISCV | BE Met | GMR Range | Passing Rate |
| 20 | 0.22 (22%) | Yes | 0.90 <= Ratio <= 1.10 | 651 (651/663=98.2%) |
| 20 | 0.20 (20%) | Yes | 0.90 <= Ratio <= 1.10 | 735 (735/752=97.7%) |
| 20 | 0.15 (15%) | Yes | 0.90 <= Ratio <= 1.10 | 781 (781/828=94.3%) |
| 20 | 0.10 (10%) | Yes | 0.90 <= Ratio <= 1.10 | 842 (842/886=95%) |
| 20 | 0.05 (5%) | Yes | 0.90 <= Ratio <= 1.10 | 882 (882/882=100%) |
| Sample Size | ISCV | BE Met | GMR Range | Passing Rate |
| 24 | 0.22 (22%) | Yes | 0.90 <= Ratio <= 1.10 | 745 (745/764=97.5%) |
| 24 | 0.20 (20%) | Yes | 0.90 <= Ratio <= 1.10 | 774 (774/803=96.4%) |
| 24 | 0.15 (15%) | Yes | 0.90 <= Ratio <= 1.10 | 859 (859/923=93.1%) |
| 24 | 0.10 (10%) | Yes | 0.90 <= Ratio <= 1.10 | 885 (885/926=95.6%) |
| 24 | 0.05 (5%) | Yes | 0.90 <= Ratio <= 1.10 | 932 (932/933=99.9%) |
Table 4. The Estimated Sample Size for Two-way Crossover Design Using Traditional Approach
| Confidence Limit | Ratio | Power | Sample Size | 0.05 | 0.10 | 0.15 | 0.20 | 0.22 |
| 90% – 111% | 0.925 | 0.8 | N | 21 | 83 | 184 | 323 | 390 |
| 90% – 111% | 0.95 | 0.8 | N | 6 | 22 | 48 | 84 | 101 |
| 90% – 111% | 1.00 | 0.8 | N | 3 | 9 | 18 | 31 | 37 |
| 90% – 111% | 1.05 | 0.8 | N | 6 | 20 | 44 | 77 | 92 |
| 90% – 111% | 1.075 | 0.8 | N | 15 | 57 | 127 | 223 | 269 |
| 90% – 111% | 1.10 | 0.8 | N | 154 | 611 | 1365 | 2406 | 2900 |


