Internal Standard Responses in LC-MS/MS Based Bioanalysis: Friend or Foe?

The use of LC-MS/MS in regulated bioanalysis is common-place due to its high sensitivity, selectivity, quantitative accuracy, and reliability. Internal standards play a key role in quantitative bioanalysis, compensating for variability in the analyte response. In recent years there has been heightened interest in monitoring internal standard responses and, where applicable, assessing their impact on the quantitative accuracy of results [1-3].
Internal standards (IS) are compounds added at a fixed concentration during the sample’s analysis to control variability due to different analytical conditions. Ideally, the IS should be added as early as possible in the sample processing (i.e., during aliquoting), so that any variability in the analyte response is tracked by the internal standard.
Thorough mixing of the internal standard with a given biological matrix in essential. Sources of variability in a given bioanalytical workflow includes but is not limited to: inconsistency in sample preparation (extraction), injection volume, competition between drug and IS for ionization during mass spectrometer detection, instrument-related issues (drift, charging etc., ) matrix effects and stability.
Under the same conditions, the IS and analyte should behave as closely as possible. Stable-isotopically labelled (SIL) internal standards, such as 2H, 15N or 13C-labelled analytes are considered the most appropriate in quantitative bioanalysis.
On occasion, SILs are not commercially available and, due to the high cost and long timelines required for custom synthesis, the use of an analog internal standard may be required. In general, a bioanalytical scientist selects the analog internal standard that closely matches the structure and physico-chemical properties of the analyte. Whether a SIL or analog internal standard are used, method validation requirements must meet the same high standards.
During the application of an assay, consistent internal standards (IS) responses throughout a run are desirable, but extraction variability and/or instrument drift may be observed, even with a SIL. Provided any observed variability is matched with calibration standards and QCs, which have their own acceptance criteria, the impact from variable IS responses on quantitation can be negligible but should be evaluated.
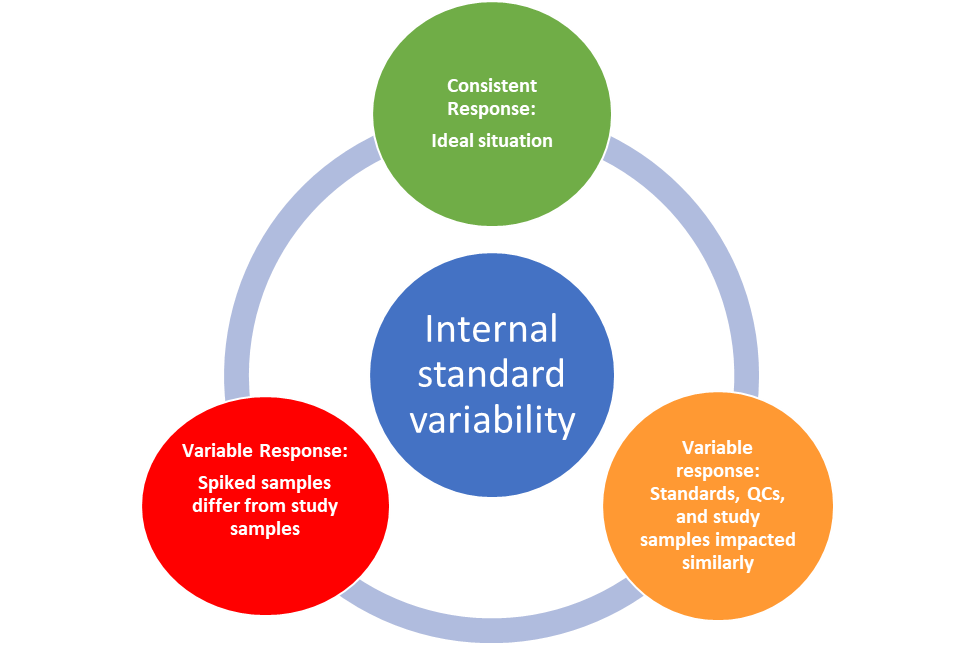
Internal Standard Variability
-
- After each batch of analysis, an IS outlier test may be applied to samples. For example, internal standard responses that are <50% and >150% of mean IS response may be selected for repeat analysis (IS outliers).
- Samples with HIGH or LOW IS responses are indicators of possible analytical issues (e.g., double spike of IS, short aliquot of IS, no IS added etc.).
- Even if IS outliers are not selected using an internal standard outlier test, IS plots should be carefully reviewed and investigations designed on a case-by-case basis when merited.
The following are some typical cases in LC-MS/MS bioanalysis when consistent and variable internal standard responses may be observed. The examples described cases where investigations may reveal that the internal standard reliably tracks the analyte (“Friend”) or reveals the need for method improvement and revalidation (“Foe”).
Case Study #1
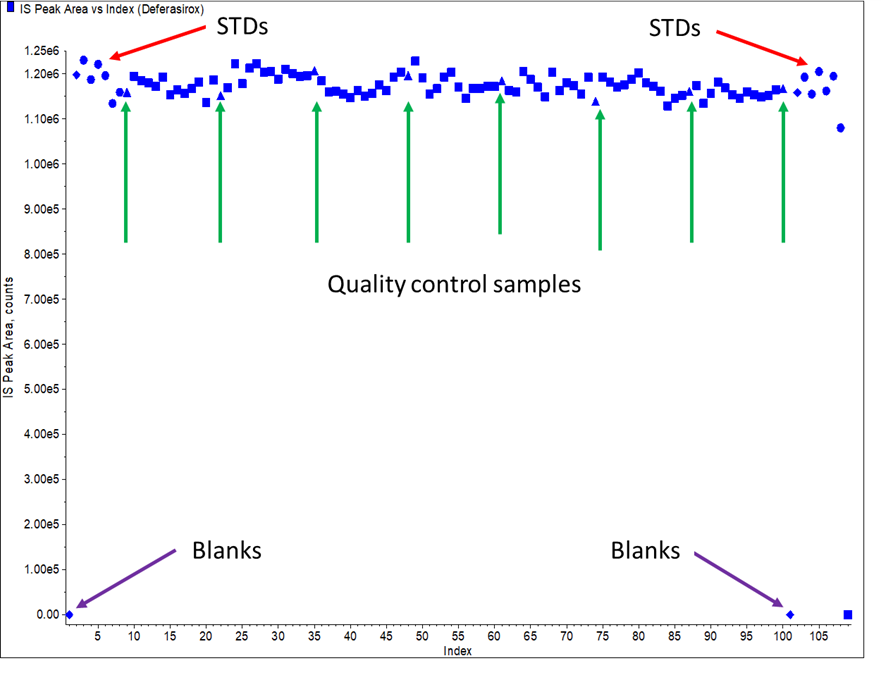
In this 1st example, the method was a simple method, involving protein precipitation extraction, with a lower limit of quantitation (LLOQ of 40 ng/mL. The internal standard selected was a SIL of the analyte. When the method was applied in a study, IS responses in QCs were consistent with clinical study samples (Figure 1). No outliers selected for repeat. In this case study, the IS was a “friend”.
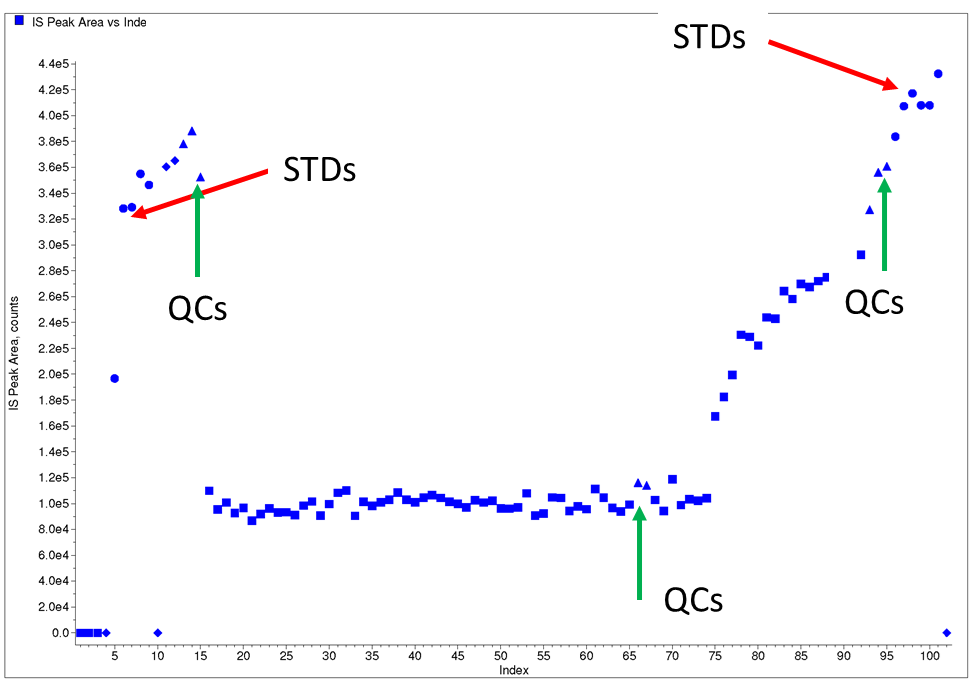
Figure 1: Typical IS plot for Case Study 1
Case Study #2
In this case study, the bioanalytical method involved a complex liquid-liquid extraction for a bioanalytical method with an LLOQ of only 20 pg/mL. The method also utilized a SIL internal standard. For many batches IS responses were relatively consistent, but upon review of the IS response for one batch (Figure 2), unusual IS responses were observed:
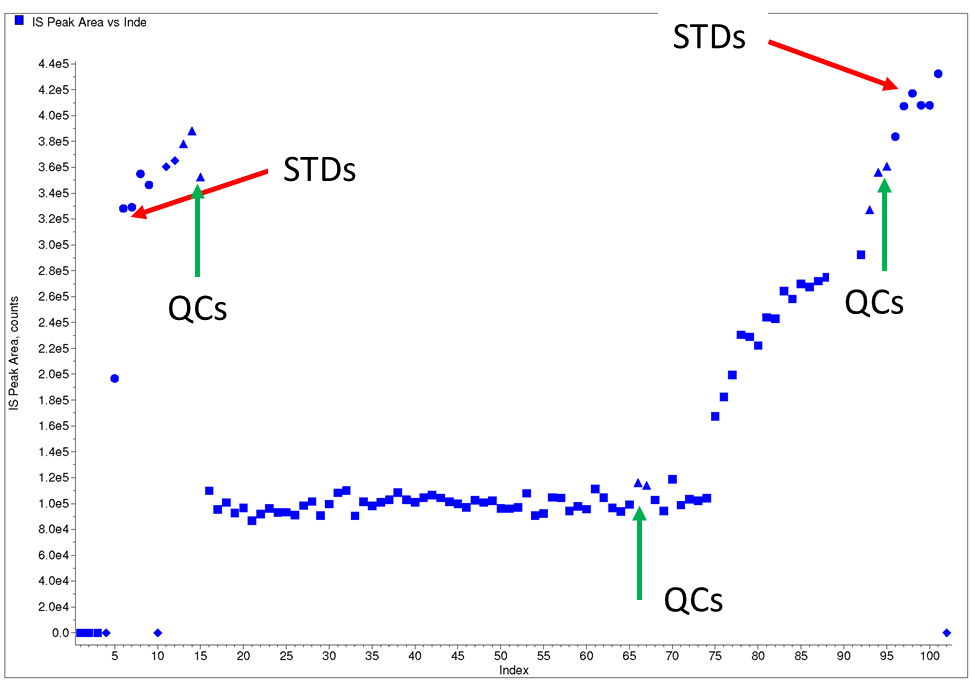
Figure 2: Example of an unusual IS plot from Case Study 2
After the injection of 10–15 samples a sudden drop in internal standard response was observed for about 60 samples (which were flagged as internal standard outliers) after which the internal standard responses gradually increased. It was also observed that internal standard responses for QCs interspersed between clinical study samples also showed the same trend. All QCs within the batch met acceptance criteria.
In this example, an investigation was performed to determine if the variable internal standard responses were caused by extraction or instrument variability. A few samples were selected with low and high internal standard responses and were re-injected and individual analyte responses (Figure 3) as well as the peak area ratios (Figure 4) were compared to those determined in the original batch.
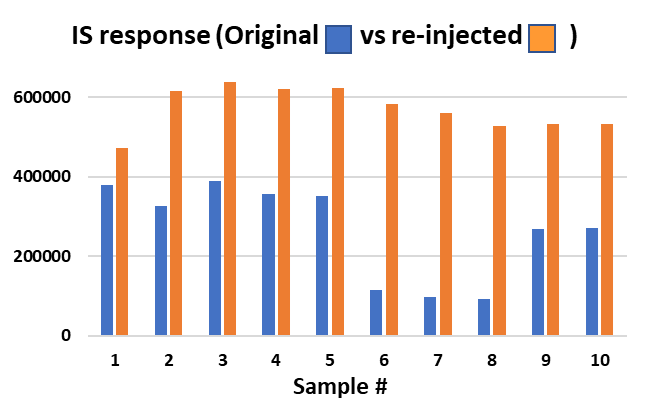
Figure 3:IS response from original and reinjected samples from case study 2 investigation.
Upon re-injection, the IS response of all the investigation samples were relatively consistent, so it was concluded that the variable internal standard response was not related to extraction. In addition, when the Peak Area Ratio (PAR) of the investigation samples were compared between the original and re-injected samples, PARs were found to be very consistent. It was concluded that the variable IS responses in the original batch matches that of the analyte and therefore had no impact on quantitation. The whole batch was re-injected and IS responses were more consistent. In this example, the internal standard was a “friend”.
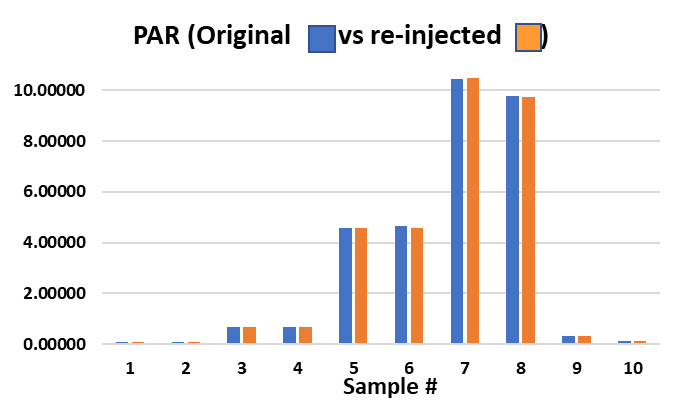
Figure 4: Peak Area Ratio (Analyte/IS response) for Case study 2 investigation.
Case Study #3
In the 3rd case study, during review of internal standard plots and application of the internal standard outlier test, a small percentage of samples were found to have very low or no internal standard. The samples were flagged as IS outliers and were repeated as analytical repeats.
Upon repeat analysis, they again had no/low IS responses. This assay required stabilization of samples with formic acid solution and extraction under chilled conditions. As maintaining the pH of the sample was found to be critical during method development, the pH of the samples with low internal standard response was tested against positive control samples (treated samples with correct pH) and negative controls (untreated samples, incorrect pH).
In this case study, samples with low internal standard responses correlated with the incorrect pH of the samples (Figure 5).
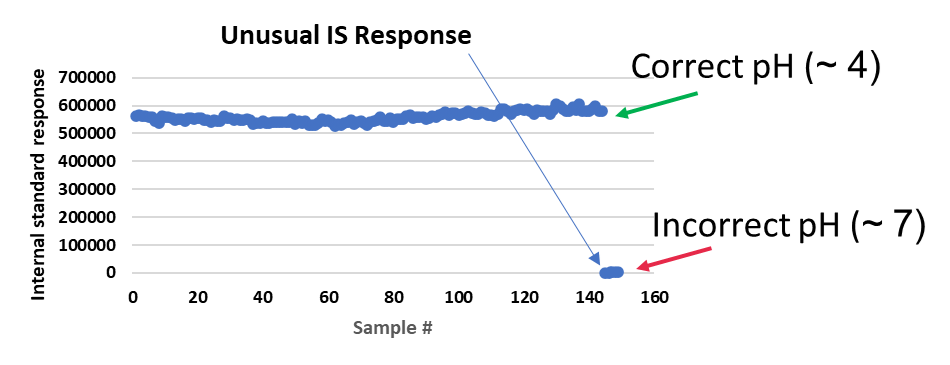
Figure 5: Typical and unusual IS responses from Case Study 3
As acidification was required to stabilize the samples, it was concluded that the IS had degraded in the improperly treated samples, resulting in the low/no response. As the analyte would also have been impacted in these samples from sample collection, freezing and thawing and extraction, the accuracy of the determined analyte concentration could not be assured, and the impacted samples were considered non-reportable. In this instance, the internal standard was a “friend” and was used to identify samples that were true outliers.
Case Study #4
In this case study, due to the lack of availability of a SIL, the method was developed with a close structural analog internal standard. When the validated method was applied in the analysis of clinical samples, the batch met acceptance criteria, but there was a systematic difference in internal standard responses between spiked samples (STDs and QCs) and study samples (Figure 6).
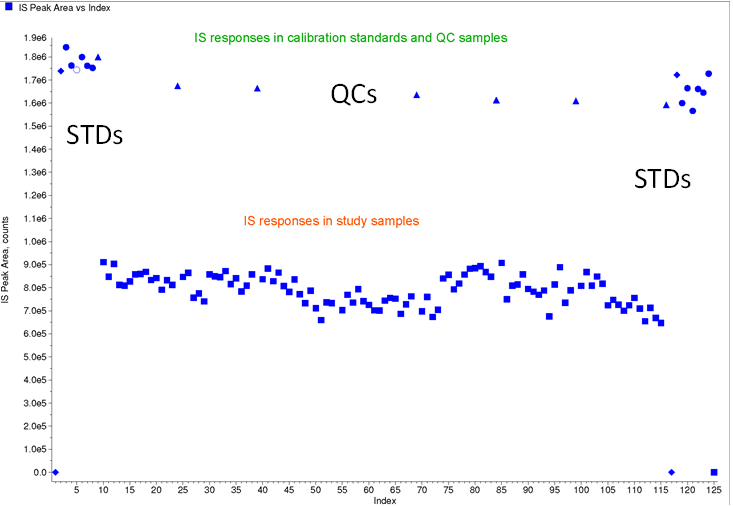
Figure 6: Internal standard plot for case study 4 (using an analog internal standard)
In this instance, a matrix effect in clinical study samples was suspected. To evaluate if there was an impact from the matrix effect in the clinical study samples, QCs at LOW and HIGH concentrations were prepared in pre-dose clinical study samples. The prepared QC samples were the analyzed using internal standard quantitation and external standard quantitation methods (Table 1).
Interestingly, using both quantitation methods, the precision of the measurement (% CV) was less than 10%, but accuracy with internal standard quantitation showed a high % bias, whereas % bias using external standard quantitation (based on analyte response only) was within acceptable limits.
In this instance, it was concluded that there was an impact from matrix effect in the clinical study samples that was not being tracked by the internal standard, resulting in inaccurate analyte measurements. In this instance, the internal standard was a “foe”, and the method was deemed unreliable.
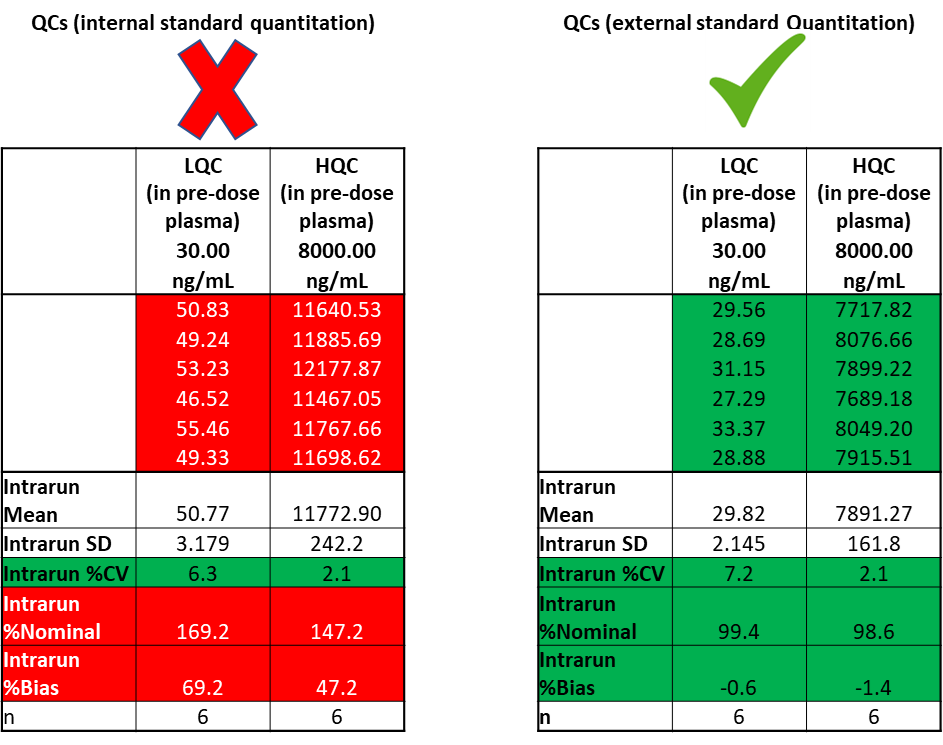
Table 1: Accuracy and precision of QCs prepared in pre-dose study samples, quantified by internal- and external-standard quantitation.
A commercial source of a SIL internal standard subsequently became available, and the method was redeveloped and validated using this material. When applied to clinical study samples analysis, internal standard response in STDs and QCs compared to clinical study samples were now more consistent and the internal standard was a “friend”
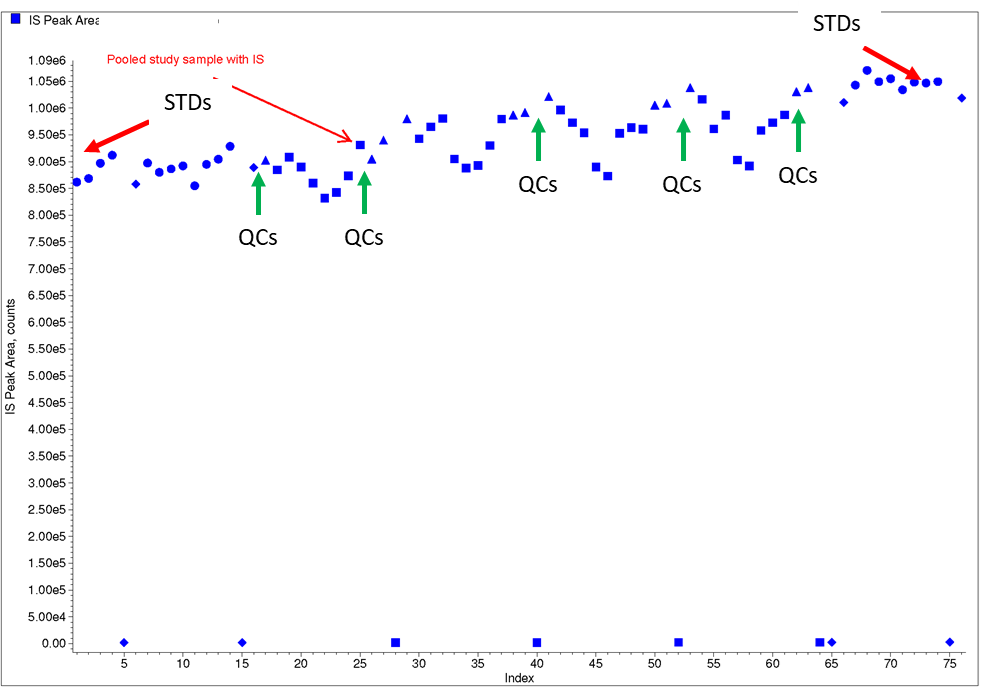
Figure 7: Typical IS plots for case study 4 using a SIL internal standard
Conclusions
- Even when a method meets the most stringent of validation acceptance criteria, continued monitoring of internal standard responses during each application of the method in a clinical study is an important consideration in regulated bioanalysis.
- Whilst consistency in internal standard responses is ideal, variations across a batch of samples can occur, and the bioanalyst should be vigilant in assessing any impact.
- If variability is observed, but the internal standard is “a friend” and correctly tracks the performance of the analyte, there is no impact on quantitative accuracy, data reliability and method reproducibility.
- Use of a SIL internal standard can also be a valuable tool to detect sample stability/integrity issues.
- There are situations where internal standards can be a “foe”, not track the performance of the analyte, and ultimately method revision and revalidation may be required.
BioPharma Services Inc. has ~300 validated assays in biological matrix available for use in pre-clinical and clinical study samples analysis. Each method is rigorously validated and for each clinical study batch of analysis internal standards plots are monitored and where applicable investigations are designed, conducted, impact assessments performed and reported.
Written by: Dr. Nicki Hughes, Senior VP, Bioanalytical Lab Operations
References Used:
- White, S., Adcock, N Elbast, W et al. European Bioanalysis forum: recommendation for dealing with internal standard variability.Bioanalysis, 6(20), 2767-2774 (2014).
- Food and Drug Administration. Guidance for Industry. Evaluation of Internal Standard Responses During Chromatographic Bioanalysis: Questions and Answers. Sept 2019.
- Fu, Y., Barkley, D., Li, W., Picard, F., and Flarakos, J. Evaluation, identification and impact assessment of abnormal response variability in regulated LC-MS Bioanalysis. Bioanalysis, 12(8), 545-549 (2020).


